Posts in category 'Bend Oregon Real Estate Trends'
Subscribe and receive email notifications of new blog posts.
 RSS Feed
- 2026 | 65 Posts
- 2025 | 103 Posts
- 2024 | 110 Posts
- 2023 | 72 Posts
- 2022 | 52 Posts
- 2021 | 70 Posts
- 2020 | 84 Posts
- 2019 | 38 Posts
- 2018 | 48 Posts
- 2017 | 39 Posts
- 2016 | 31 Posts
- 2015 | 10 Posts
10
Bend Oregon Real Estate | March 2019 Trends
Bend Real Estate Sales Down
March 2019 Bend real estate sales followed the trends noted earlier in the year. Although there was a seasonal uptick in March 2019 of Bend single family residential home real estate activity, new home listings, those in pending status and those sold were significantly down.
- Numbers of homes for sale down 15.1% to 377*
- Numbers of homes sold down 27% to 149
- Numbers of homes pended down 8.6% to 201
Bend Home Prices Up
While actual sales are down, the average price of a Bend single family home continues to rise. Comparing March 2018 with March 2019:
- Average price per square foot on sold homes up 6.3% to $252
- Average active price up 4.9% to $682,000
- Average sold price up 8.9% to $536,000
22
Bend Oregon Real Estate - What's Up With New Home Construction?
Permits Down for New Bend Homes
After many years of growth in new home construction in Bend, the number of permits pulled so far this year for single family homes are significantly down compared with previous years. From a high of 117 in March 2017, February 2019 had the lowest number of new home permits pulled in 4 years with less than 40.* February is typically a busy month for builders obtaining permits to build homes for summer sales. This decline is significant as it is not following the normal trends.
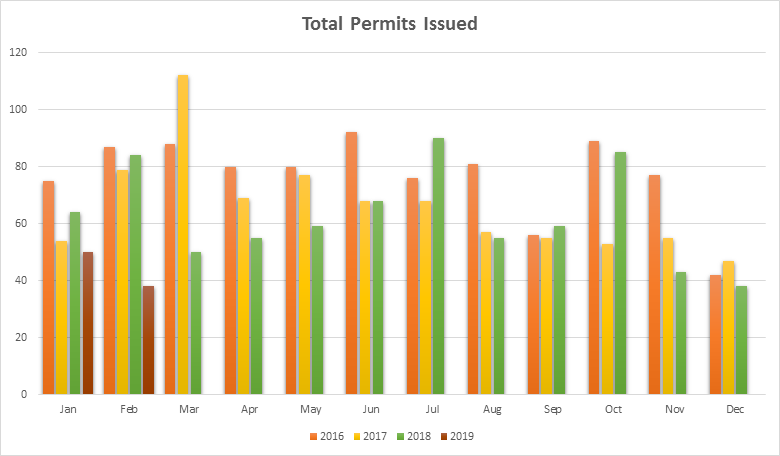
Why Are Bend Builders Not Pulling Permits?
When a good analysis of Bend home trends is looked at, it becomes obvious that Bend new home construction has slowed. Many builders are sitting on inventory and while prices have continued to rise, sales have s...
6
Bend Oregon Real Estate | February 2019 Trends
Bend Real Estate Market Changing
February 2019 had the most dramatic change to the Bend Real Estate market that we have seen in many years. Sales dramatically declined while prices increased, although at a reduced rate than we have experienced over the past few years. It appears that the trends we started to see the second half of 2018 are continuing.
When February 2019 is compared with February 2018, the data for Bend single family residential sales on less than an acre are as follows:
- Numbers for sale down 6.6% to 398
- Numbers sold down 36% to 105
- Numbers pended down 17% to 151
- Average price per square foot up 2.9% to $248
- Average days on market unchanged
- Sold/Original listing price different down 1% to 96%
- Average active price up 6.2% to $681,000
- Average sold price up 3.1% to $498,000
15
Bend Oregon Real Estate | January 2019 Trends
Bend Home Sales Showing a Decline in Early 2019
Those of us involved with day to day real estate sales have "felt" a change in the market for several months. Bend home prices which have been rising for the last several years have continued to grow, but sales have been flattening. Buyers which were so ready to purchase have developed a "wait and see" attitude and the homes which were so quick to sell not long ago are taking much longer.
If the sales data for Bend Oregon single family residential homes from January 2019 is compared with January 2018, the following changes can be noted:
- Homes for sale down 4% to 382
- Homes sold down 12.6% to 125
- Homes pended down 27.6% to 144
- The average price per square foot is up 7.5% to $245
- The average days of market is up 5.8% to 127
- The sold/original listing price percentage is do...
8
Bend Oregon Real Estate | December 2018 Trends
Is the Bend Real Estate Market Overpriced?
The figures are out and the trends we have been following over the past year were again seen in the December 2018 Bend residential real estate sales figures. December 2018 saw a dramatic reduction in Bend home sales on less than an acre compared with December 2017:
- Numbers of homes for sale down 10.4% to 396
- Numbers of homes sold down 15.9% to 159
- Numbers of homes pended down 14.4% to 131
- Average price per square foot on sold homes up 3.8% to $244
- Sold price to original listing price difference down 2.1% to 95%
- Average days of market up 2.8% to 111
- Months of inventory up 8.6% to 2.5 (based on closed sales)
- Average active price up 5.6% to $701,000
- Average sold price up 14.3% to $521,000**
The figures for act...